A layman’s guide to why dose mapping is important for E-Beam.
Most radiation sterilization concepts are not that difficult to understand, but, like many technical specialties, there’s a lot of jargon that gets thrown around when the process gets discussed.
And, as always, most people are on average afraid to ask simple questions – so we’ll do that for you here and save you the textbook reading.
ISO 11137 Provides the Framework for Creating a Device-Specific Sterilization Process
Gamma and E-Beam are the two dominant radiation sterilization modalities that exist today.
ISO 11137 (Radiation sterilization for medical devices) describes how to design a high-quality radiation sterilization process, establish the proper dose for sterilization, and then measure & control this process once it is in production. Notably, 11137 is generalized for all forms of irradiation – the procedure is the same.
In sum, the radiation sterilization validation process involves:
- Establishing a sterilization dose (Dster) that we demonstrate can sterilize the product to the target sterility assurance level (SAL) – for most medical devices, 10-6 (less than a 1-in-1 million probability of a single microbe on the device).
- Establishing a maximum dose (Dmax) limit above which the product will have either its performance or marketability degraded.
- Assuring that the sterilization modality selected can deliver the target dose between these two values through all of the critical parts of the fully packaged device.

Dose Mapping
When it comes to radiation sterilization, the proper grilling of a thick steak again provides a good analogy: The middle of the steak cannot be undercooked, while the outside of the steak should not be incinerated.

In the same way, with radiation sterilization, we are seeking to provide the minimum (e.g. required for sterilization) dose while staying below the maximum dose (e.g. dose above which the product may be damaged) throughout the packaged product.
The dose mapping process is the qualification step by which we determine where the minimum and maximum (think “hot or cold”) points are in the product, and what the ratio of dose is between the two.
How Does Dose Distribution Actually Work? We Start with 1-Sided Processing…
The penetration curves for 10MeV (million electron volt) E-Beam are well understood and typically illustrated in a homogenous-density material (typically water, with its density conveniently 1 g/cm3.) An example of a single-sided curve is shown below:
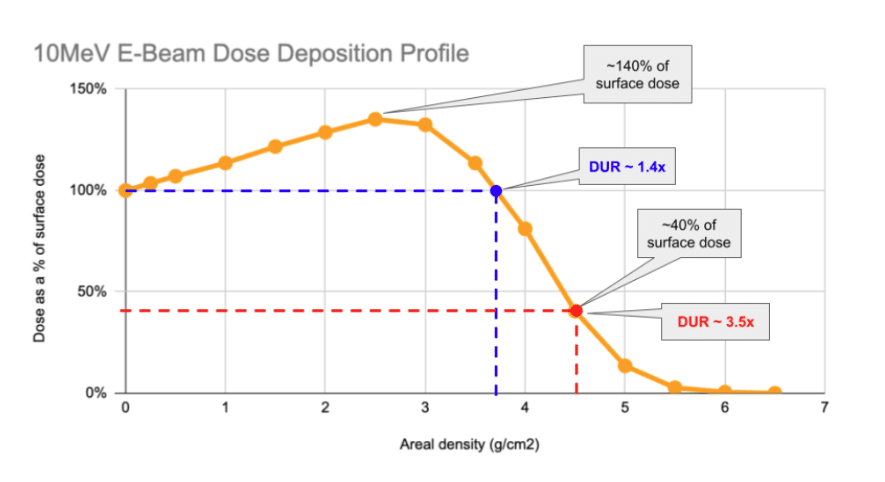
As can be seen above, the characteristic profile of the single-sided depth-dose curve involves a rise in the first ~2.5g/cm2 of material the beam impacts before it begins to progressively decrease.
Understanding the nature of the x-axis on this chart is critical. E-Beam’s penetration limit is governed by the amount of mass that the beam must pass through. The quantity on the graph – area density – is the amount of mass under each square centimeter of the product that the beam impacts. The below example shows how two boxes of different density product can “look” the same to an E-Beam:
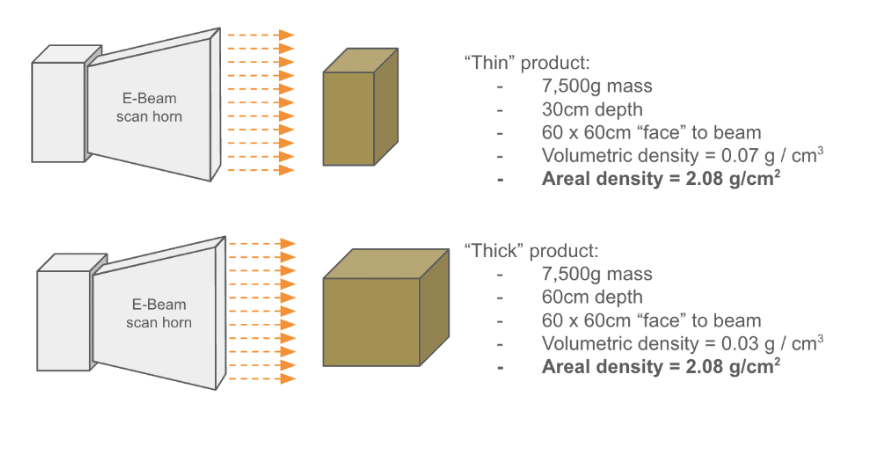
So, with single-sided processing, under each cm2 of area, up to around 4 g of product may be processed before the DUR of the product begins to climb above acceptable limits.

A DUR-by area-density chart is shown above. As can be seen, the DUR begins to climb steeply above 4 g/cm2, effectively making most products not practical to process with 1-sided processing.
Enter 2-Sided Processing… and Goldilocks
The natural next question to ask is as to whether you can get better depth performance by shooting from two sides. The answer: of course!
Perhaps unsurprisingly, shooting a product (again, using the homogeneous product assumption), allows the effective depth of penetration to be doubled. How well this works again depends on the product’s areal density.
In the examples below we assume a density of 1g / cm3 to keep the math simple (typically, medical devices are far less dense, yielding much great depth of penetration.)
In the below case, the product is too thin. 1 1g/cm3 the red and blue curves overlap too much in the middle, producing a combined (the purple curve) maximum dose in the center of the product. The DUR of this example is ~2.5x. While many products can tolerate DURs like this, effectively the dose available is “wasted” in the sense that it just worsens/increases the dose in the middle of the product. Widening the product could help more productively distribute this energy.

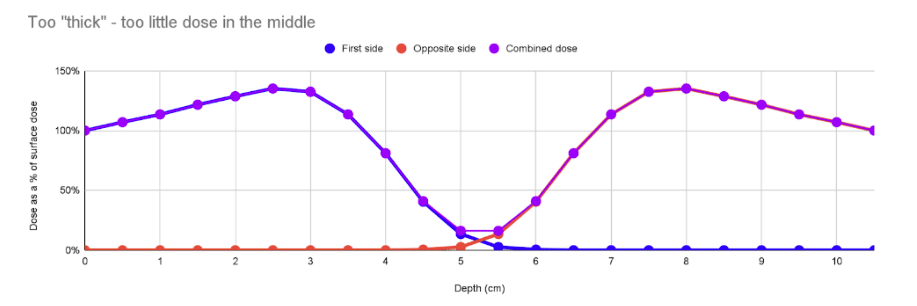
In the case below, the product is wider with the same density. However, it’s wide enough that the interaction of the blue and red curves in the middle is very low, leading to a “cold” spot in the middle, and a high DUR of 8.3. This is more common: not enough penetration. In these cases irradiating the product along a thinner axis or making it narrower can help.
In an optimal case, the product is sized such that the amount of mass between the two beams is optimal, and the resulting composite curve presents a very low DUR (typically ~1.4). This is the “Goldilocks” case – where the total amount of mass between the two beams is ~8.8g/cm2.
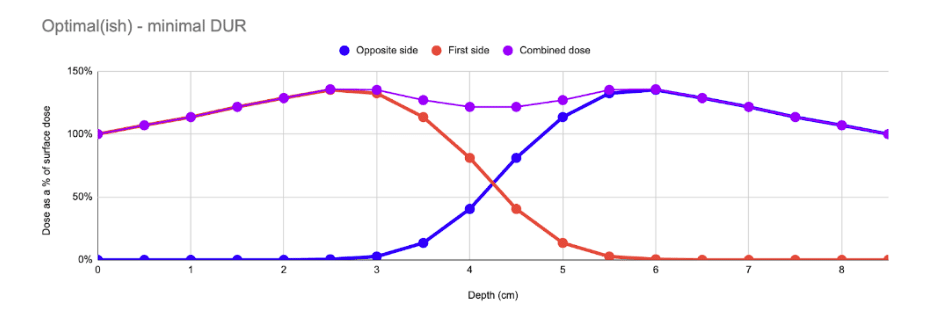
So, to efficiently achieve optimal DURs, the areal density of the product must be optimized, and the punchline is that the mass between the two beams should be around 8.5g/cm2. The chart below (again assuming homogeneous density) shows that DURs reach optimal low values of ~1.6 around this point… making this the most efficient way to utilize double-sided E-Beam processing.

This Is So Simple! But What Does This Model Not include?
As always, theory can be misleading. As mentioned above, the major assumption here is the constant density assumption – very rarely true for most medical device products.
So where is this model representative? Unfortunately, there are many common situations where the homogenous-density assumption breaks down. See the table below for situations where the homogeneous-density assumption is representative:
| Representative | Not representative |
|---|---|
|
|
The presence of excessive airspace – especially perpendicular to the beam’s plane – can cause average areal density to be significantly underreported. Likely the best example is one solid, high-density product in the middle of a rather oversized box. While the entire box may have on average a low areal density, the actual areal density of the product itself may significantly exceed the ~8g/cm2 limit where E-Beam functions well: for this reason, it’s best to understand the packaging geometry of the product as well as its average areal density before we recommend dose mapping the product.
The concepts presented in this piece are helpful to understand how E-Beam functions, but ultimately a properly-planned dose mapping study is the right way to fully understand how the product will perform in E-Beam.
Takeaways:
- Considering how E-Beam processing, in both single- and double-sided modes, can drive efficiency can be used to optimize capacity and lower cost.
- For most medical devices with average densities between 0.1 – 0.2g/cm3, E-Beam penetration depth can be 40-75cm (approximately 15-30” in depth) assuming constant density. More typically, E-Beam operates more comfortably at a <30cm (<12in) max depth. Again, dose mapping is straightforward and conclusive test for what is possible to achieve on depth-dose performance.
- Though the homogenous density assumption is rarely true in practice, it provides a good “starting point” for understanding beam penetration performance. Still, only a properly executed dose map can determine what the product’s dose range will be.
NextBeam Is Here to Help
As always: you don’t need to be an expert in the optimization of E-Beam processing to successfully qualify your product in E-Beam. At NextBeam we evaluate depth-dose distribution and other aspects of real-world processing to help you and your team succeed. Contact us today for a free consultation.